Trant said...Challenge accepted:
Current levels of CO2 in atmosphere is 391ppm : source
en.wikipedia.org/wiki/Carbon_dioxide_in_Earth's_atmosphere
Increase of CO2 per year is about 2ppm : source
en.wikipedia.org/wiki/Carbon_dioxide_in_Earth's_atmosphere
CO2 is responsible for about 3.618% of Global Greenhouse effect : source
www.geocraft.com/WVFossils/greenhouse_data.html (table 3)
Amount of sunlight hitting Earth is 240 Watts/m^2
(source : anywhere on the web)
The current greenhouse effect doubles this as radiation is absorbed by the greenhouse layer and re-emitted (of which 50% back to earth with each 'reflection')
source :
www.lpl.arizona.edu/~showman/greenhouse.htmlTotal energy hitting the Earth is about 480Watts/m^2
The simple equation for working out the temperature of a blackbody in equilibrium with a certain amount of heat loss is :
F = &sigma T^4
where F is heat flux
&sigma is the Stephen Boltsman constant (5.67*10^-8)
T is the temperature
Currently this would calculate the temperature as :
T = (F / &sigma) ^ .25
T = (480 / 5.67*10^-8) ^ .25
T = 302.9 Kelvin (which is about 29.75 centigrade)
After 20 years the concentraion of CO2 in the atmosphere will increase by 20 *2ppm = 40ppm (as above),
This is an increase of about 10%
So now the heat flux is increased by 480 * 10% * 3.618% = 1.411
So the total heat flux is 481.411
The new temperature (after achieving equilibrium) would be
T = (F / &sigma) ^ .25
T = (481.411 / 5.67*10^-8) ^ .25
T = 303.2 Kelvin (which is about 30.05 centigrade)
So even this simple model says an increase of .3 degrees after 20 years
After 50 years this becomes an increase of
T = (F / &sigma) ^ .25
T = (484.35 / 5.67*10^-8) ^ .25
T = 303.6 Kelvin (which is about 31 centigrade)
So my very simple model predicts an increase of .7 centigrade after 50 years.
This is assuming that we stay at the current level of CO2 emissions (which is not happening)
This also ignores the other greenhouse gasses, feedback systems, the Earth's albedo, cloud cover etc. etc.
obviously a real calculation would include more factors, I would imagine the most important being that any increase in temp will increase the amount of water vapour in the atmosphere, which is another greenhouse gas
This is a simple demonstration of
more CO2 = higher temperature.
Now I'm waiting for your dust / Formula 1 car calculation...
1.- I completely accept that Earth without multi atom gases would be ~255 K
2.- How do you get 480 * 10% * 3.618% = 1.411?
=============
3.- Anyway using your arbitrary 480w we get black body (480 / 5.67*10^-8)^ 0.25 =
30.18C Now with your arbitrary 481.411w (481.411 / 5.67*10^-8)^ 0.25 =
30.40cSo 0.2c after 20 years > not accounting for CO2 effective saturation which basically says there is almost no CO2 greenhouse effect after 300ppm you get 0.2c increase.
Absorption rates aren't even linear (
www.john-daly.com/artifact.htm).
Now let's take some real figures
Year = 2009
C02 = 387 (
en.wikipedia.org/wiki/Carbon_dioxide_in_Earth's_atmosphere)
CO2 % warming effect = 3.618... I have an issue with this as I don't know what 387ppm really represents, and you have the same problem.
Global Temp = 14.46?C (
www.ncdc.noaa.gov/sotc/global/2010/13)
Temp = (388 / 5.67*10^-8) ^ .25 = 287.61500 kelvin = 14.46500 Celsius
With your 10% and linear effect
388 * 10% * 3.618% = 389.40; (389.40 / 5.67*10^-8) ^ .25 = 287.875k = 14.72500C
Applying the same logic to the pre IR of 288ppm or a %0.908 reduction of overall effect (0.75c) which doesn't correlate with readings.
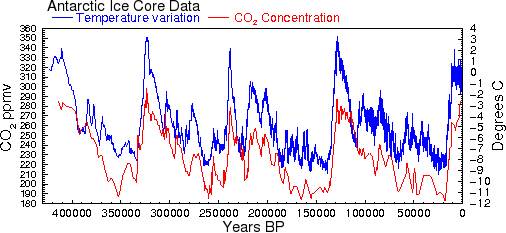
use the 255K zero-greenhouse gas data point, where there is zero CO2, as a data point, and fit the other points to a smooth curve. To maximize the accuracy of the estimate, we will only use global CO2 and temperature values between 1900 and 2000 (
lwf.ncdc.noaa.gov/oa/climate/research/anomalies/anomalies.html), about which there is relatively little dispute, and ignore estimates of prehistoric values, which could be more affected by changes in solar flux and other factors. This gives a total of 102 data points. These points are shown in blue in the figure below.
Including the CO2 = 0 data point severely constrains the shape of the curve (and, interestingly, effectively rules out any sort of hockey stick-shaped curve). It is also clear that some sort of monotonically-increasing curve, and not a straight line, has to be used. The best fit was obtained with a hyperbola. If the 102 data points are fitted to a hyperbola, we obtain 288.92 ?0.27K (?1 SD) for 736 ppm CO2 (red line).
The present-day value is taken as the average of the global mean temperatures between 1980 and 2000, or 287.17K. If the above estimate is correct, this means that the temperature would increase by 1.76 ?0.27?C above the present-day value when CO2 levels double their present levels. This is very close to the 1.85?C calculated above.
Stated differently, doubling CO2 from its pre-industrial value would increase the temperature about 1.2 degrees Celsius.
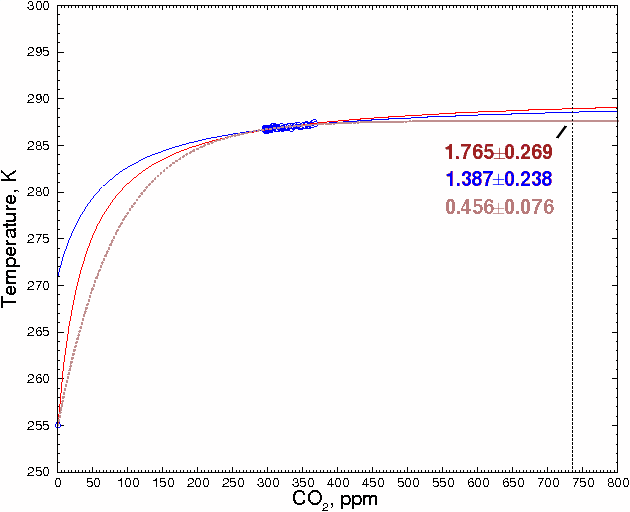
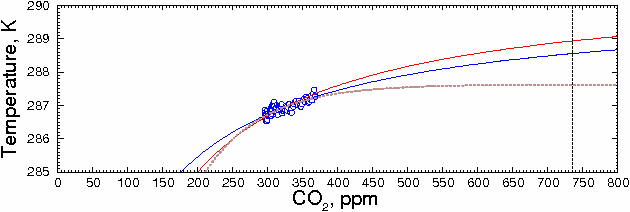
However, there is a problem with this method. The 255K data point is not just zero CO2, it is zero water vapor as well. In reality, there would always be some water vapor present, even if there were no CO2. This means that the actual temperature for zero CO2 would be higher than 255K, which would change the shape of the curve. For example, if the CO2=0 value was 271 (halfway between 255 and the current temperature), the prediction changes to 288.55K, or about a 1.39 degree increase for doubling of CO2. This can be seen in the blue curve (see enlarged graph below). The result is not much different than the 1.76, but the important point is that as the estimates become more realistic, the predicted temperature does not increase, but decreases slightly.
Fitting other curves to these data points gives similar results. For example, Ted Ladewski suggested deriving an exponential curve from Beer's Law. Although there are obvious problems involved in applying Beer's Law quantitatively to a transparent medium as complex as the atmosphere (as he discusses in greater detail on his website,
mysite.du.edu/~etuttle/weather/atmrad.htm#Spec), the equation he recommends is:
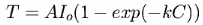
where AIo and k are constants, C is the CO2 concentration, and T is temperature. (This is also discussed in
www.sjsu.edu/faculty/watkins/GWnonlinear.htm )
Fitting the data to this equation, as shown in the brown curve in the figure above, gives the much lower value of 287.62?0.07 K (?1 SD), or
0.46?0.08 ?C increase above the 1980-2000 mean for a doubling of CO2 from current values. And this is still theoretical and hotley disputed by the "The Saturated Greenhouse Effect Theory of Dr. Ferenc Miskolczi and Prof. JAMES R. BARRANTEAlthough extrapolating beyond the ends of the data, as is done here and as is done with climate models, is hazardous, it's clear that both of these curves are significantly lower than a straight linear estimate. The hyperbola is probably closest to the actual value, because it makes the fewest assumptions about the underlying physical processes. In any case, both estimates should be regarded as upper limits because, as mentioned above, they assume that CO2 is the root cause of the observed changes in temperature.